
Up to 43%
Of all website transactions driven by email.
$700K
Revenue generated for a single brand.
My Role
Lifecycle Marketing
Timeline
5 Months
Key Deliverables
Email Campaigns, Automated Flows, Email Design, Weekly Performance Reporting, Campaign Calendar
Skills
Lifecycle Marketing, Email Marketing, Campaign Strategy, Email Design, Performance Reporting
Brands I’ve worked with
13+ brands · 50+ flows built








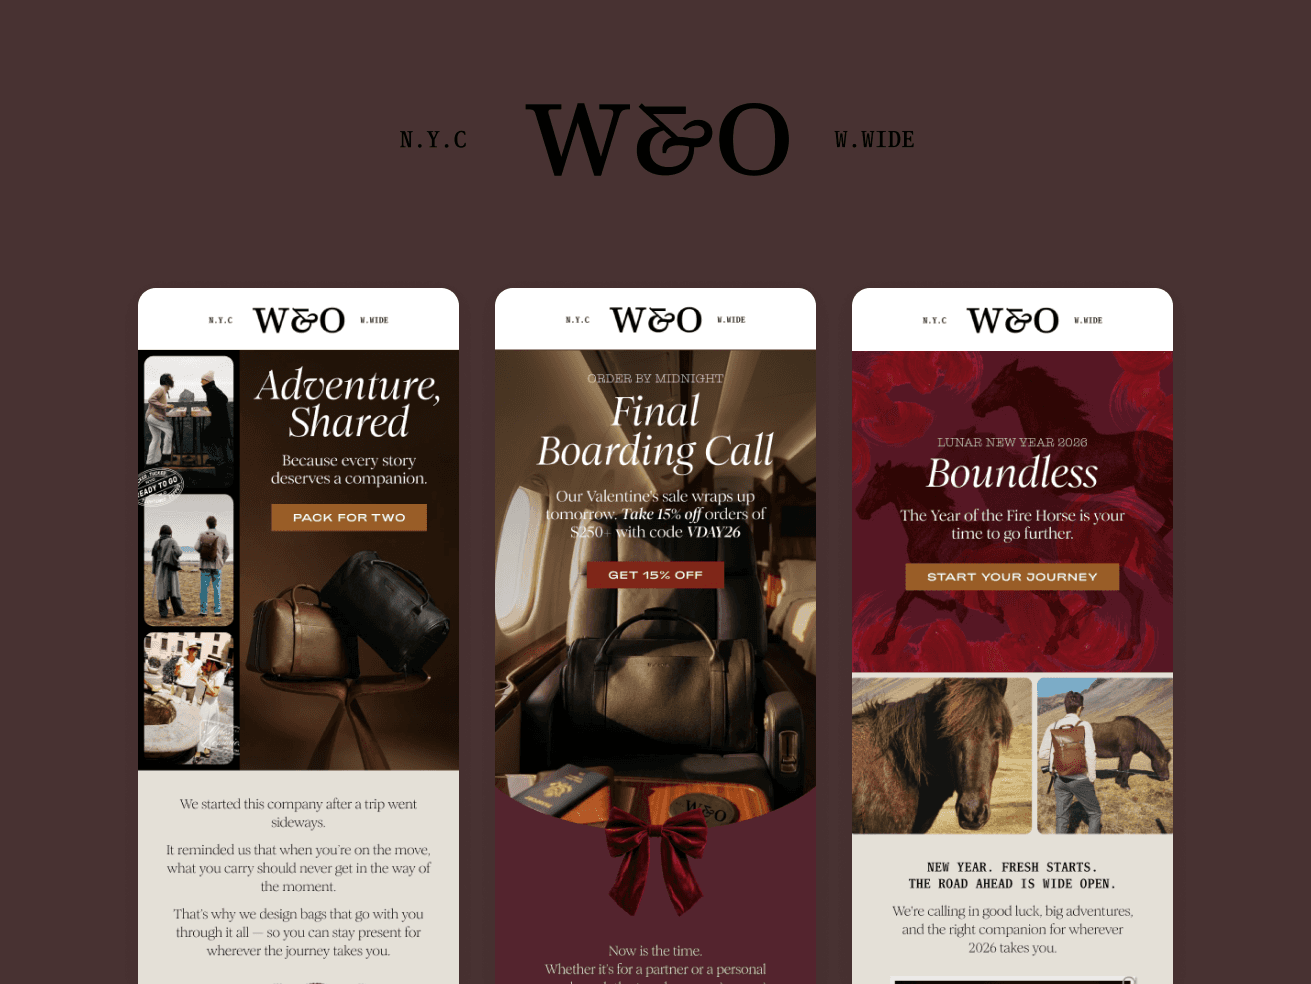
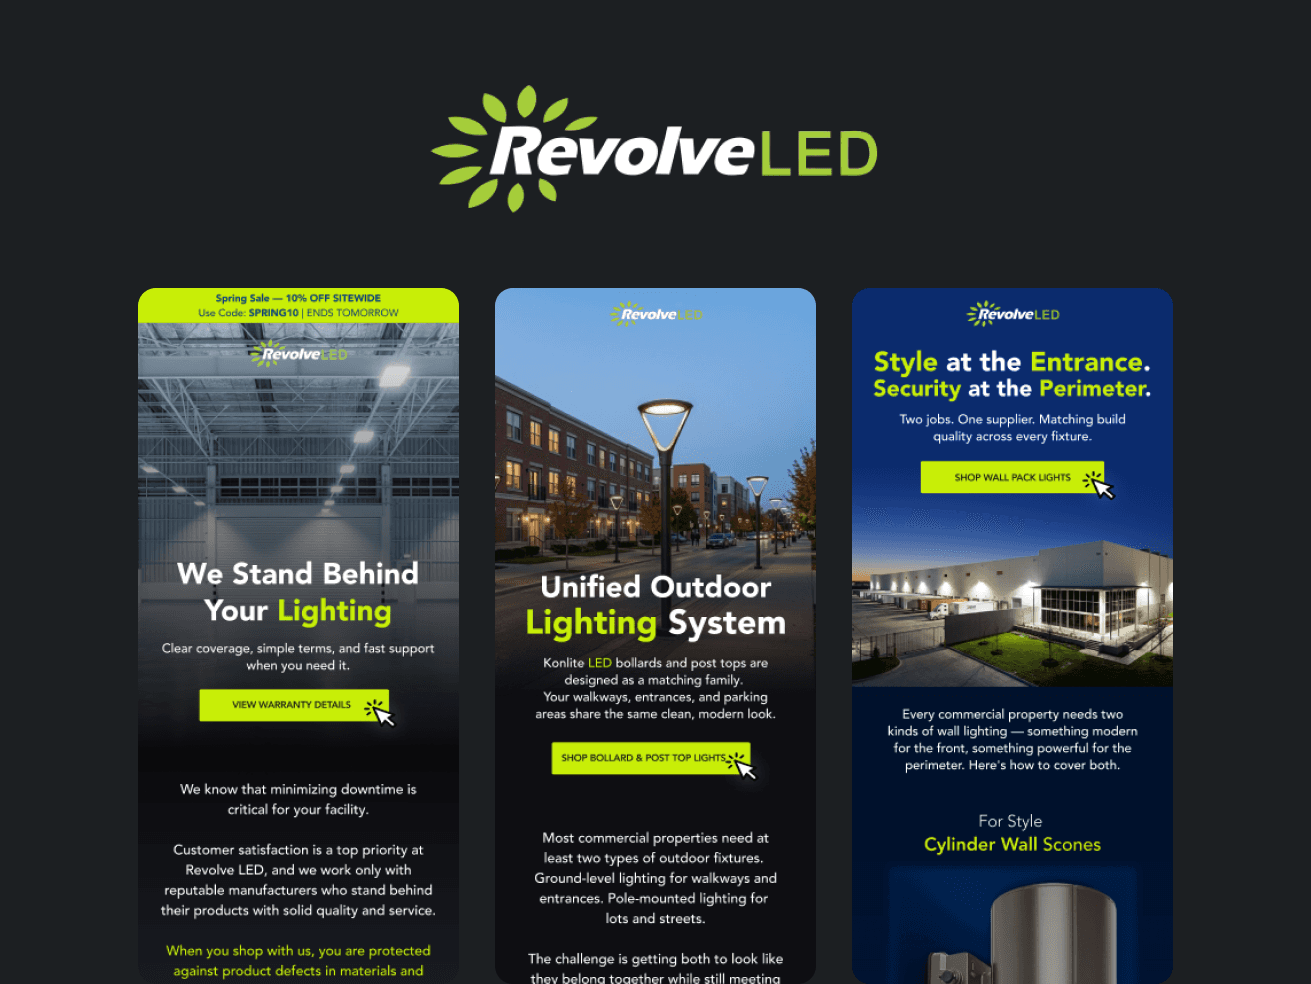
Email design
Campaigns and flow creative




How I worked
Plan → Brief → Build → Report
Four brands could be running at once, so the work had to be a repeatable loop.
Plan the month, write the brief, build the thing, report what it made.
Plan
Every month I ran a calendar call with each brand. We mapped promotions against stock levels, upcoming sale periods, and what was moving in their category. The output was a dated campaign calendar the brand signed off on, so nothing got built without a reason to exist.

Monthly campaign calendar
Brief
Every campaign started as a brief: offer, audience, send window, and the one thing the email had to do. I wrote the copy from that brief, which meant the subject line, hierarchy, and single call to action were decided before design started.

A typical campaign brief and the copy written from it.
Build
Then I worked with designers to shape the emails in Figma and built them out with dynamic content pulled from event and profile properties. Flows were where the compounding happened. Welcome, browse abandonment, cart and checkout recovery, post-purchase, and winback, each mapped as branching logic with wait times, split conditions, and exit rules before a single template was built.

Anatomy of a campaign email: the decisions behind each block.

Lifecycle flow logic across the journey: triggers, profile filters, and exit rules.
Report
Then I reported it back. Open and click rates were the diagnostic, but attributed revenue was the number that mattered, tracked weekly per brand. The next month’s calendar was built from that read rather than instinct, which closed the loop.
Top performing non-sale campaigns
Rank
Campaign
Revenue
1
Low & Slow: Rise of Mindful Drinking (Brewers)
$24,429
2
Brewers: Flavor Unleashed - Crafting the Unexpected
$15,665
3
Natural Colors
$5,161
4
Presidents’ Day Patriotic Bakes
$4,014
5
Beverage Infusion Product Focus
$3,287
Weekly performance read, revenue attributed per flow and campaign.
Want the thinking behind these flows?
Every brand came in with a different lifecycle gap. Happy to walk through the diagnosis, the flow logic, and what moved.
Get in touch